Analyst coverage, price structure, news sentiment and fundamentals sit in four different places, on every name you follow. We read all four after every close and write down where they land, as one score per stock, plus a divergence figure for the days they disagree.
Three layers lean bullish, price does not. The headline score comes out mild because it is averaging an argument, and the divergence figure is how you know that is what happened.
Fixed illustration on invented figures. Not a live reading, not a recommendation.
It is scattered. Every source you would check is public, free and a click away, and that is the problem: the price chart, the headlines, the analyst revisions and the last filing each hold a quarter of the picture, and none of them tells you the other three exist.
So the picture gets assembled by hand, one stock at a time, and only for the names you happen to worry about that morning.
We run that pass across every stock we cover, after every close. Four layers, one score, and a separate figure for how far apart they read, because a stock two sources disagree about is not the same as a stock they agree about, even when the average lands in the same place.
We collect data across multiple independent dimensions: analyst coverage, price structure, news sentiment, and fundamentals, then synthesise it into one unified bias reading per equity.
No single source dominates. The value is in the combination, and in surfacing where sources disagree.
How professional research coverage is positioned and moving across the universe we track.
Where price action sits in its broader market structure, interpreted as a directional state.
How the market is talking about, treating, and positioning around a stock, beyond raw price.
Valuation and balance-sheet health, read against the stock's own sector rather than in isolation.
Every design shows the same scored list. Pick the one that matches how you work, switch whenever you like, and run either of them in dark or light.
Fintech
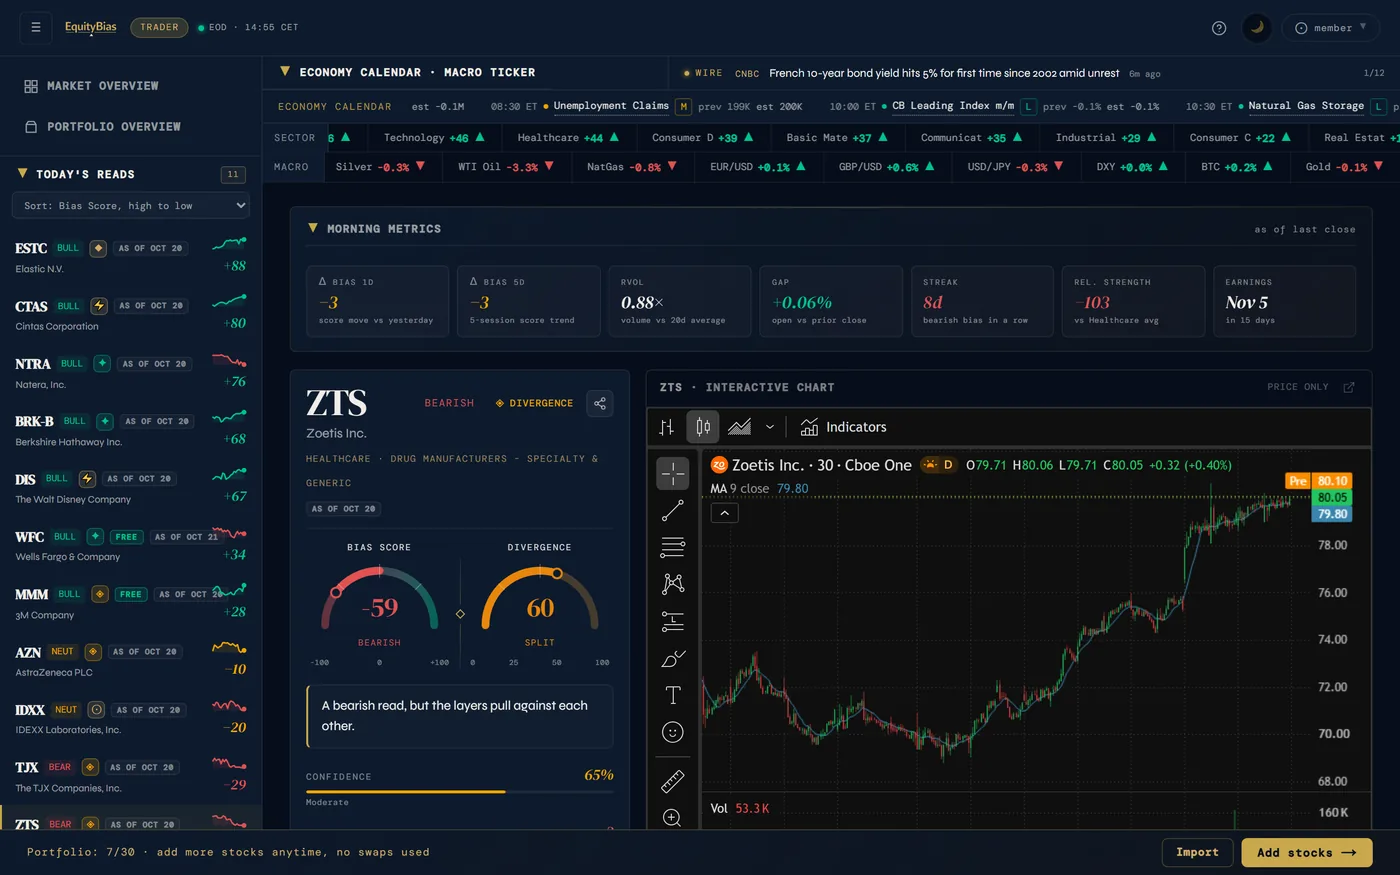
LightThe layout every account opens on. Your list down the side, and whichever stock you pick from it opened up beside the chart. Built for the five minutes before the open.
Real screenshots of the Trader dashboard from a single session. The readings in them are that session, not today.
A bias score tells you where consensus stands on an equity. But which equities are worth reading today? We use seven analytical lenses to surface different angles each morning, so you do not start your day with the same list as yesterday.
An equity where bias changed sharply overnight.
Where data sources point in opposite directions.
An equity running against its sector.
Where all four pillars agree on direction.
Where the analyst view diverges from the rest.
Extreme bias with elevated confidence.
A name not surfaced recently, from a broader rotation.
Two daily reads on Free. Ten daily reads on Premium, spanning all seven lenses. Trader Mix adds these reads on top of your own 40-stock portfolio.
Free report on five stocks you follow, then a scored pick in your inbox every market morning. Confirm your email and the report is on its way. No card.
Four stages transform fragmented market data into a single structured bias reading.
We gather data across analyst coverage, price structure, market sentiment, and macro conditions for every covered equity, every trading day.
Each dimension is standardised to a common scale, so all sources can be compared fairly regardless of their original format or range.
Our proprietary weighting engine combines all dimensions into a unified reading, and measures divergence where sources disagree.
A single bias score between -100 and +100 is output per equity after every market close. Structured. Quantified. Unambiguous.
The market is not irrational. It is biased, and the bias sits in too many places to see at once. We show what the data says. What you do with it stays yours.
Divergence is a 0 to 100 measure of how far apart the four data layers read on the same stock on the same day. Analyst coverage, price structure, news sentiment and fundamentals each form their own view, and divergence is the distance between them. The names below are today's widest gaps across our covered universe. A high divergence does not mean one layer is right and the others wrong, and it is not a forecast: it means the stock is being read two different ways at once, which a single headline score hides. That is the whole reason we measure the gap.
Choose the tier that fits your workflow. From daily bias readings to full institutional-grade equity analysis.
Founding pricing, locked for life for the first 200 members
Pick up to five names you hold or follow. We send back the current Bias Score for each one, with the four data layers behind the number, so you can judge the tool on your own positions instead of ours. Create a free account with the same address and those five stay on your dashboard, updated after each close. The daily read is free; the full Bias Score behind it is part of Premium.
Get your free reportEquityBias reads four independent layers of public market data on every stock it covers, analyst coverage, price structure, news sentiment and fundamentals, and gathers them into one Bias Score from -100 to +100, plus a divergence score measuring how far apart those four layers read. It is a research tool that does the first pass of collecting and organising, not a signal service. It does not predict prices and it never tells anyone to buy or sell.
People who already hold or follow their own stocks and want the morning read on them in one place instead of rebuilding it across a charting tool, a news feed, an analyst page and a filing every day. It is built for a daily and weekly rhythm, not for intraday trading: scores are recalculated after each US close and published before the next open.
Yes. The free watchlist report at equitybias.com/watchlist takes up to five stocks you name yourself and returns their current reading with all four data layers, with no account and no card. Creating a free account adds a daily scored pick and the dashboard.
Nothing stops you, and EquityBias is not a replacement for judgement. What it replaces is the assembly: reading four sources on one stock takes minutes, and doing it across a whole watchlist before the open is the part that quietly does not happen. The score is the output. The organised view, including where the four sources disagree, is the product.
More on how the score is built, what divergence measures and where we stop: the full FAQ, the glossary and how we work.
EquityBias doesn't tell you what to do. It shows you what the market is showing: aggregated, structured, and presented without bias of its own.
Five stocks scored free. A new one every market morning.